Medulloblastoma (examples.medulloblastoma)
This module demonstrates the ability of NMF to recover meaningful biological information from childhood brain tumors microarray data.
Medulloblastoma data set is used in this example. The pathogenesis of these childhood brain tumors is not well understood but is accepted that there are two known histological subclasses; classic (C) and desmoplastic (D). These subclasses can be clearly seen under microscope.
Note
Medulloblastoma data set used in this example is included in the datasets and does not need to be downloaded. However, download links are listed in the datasets. To run the example, the data set must exist in the Medulloblastoma directory under datasets.
This example is inspired by [Brunet2004]. In [Brunet2004] authors applied NMF to the medulloblastoma data set and managed to expose a separate desmoplastic (D) class. In [Brunet2004] authors also applied SOM and HC to these data but were unable to find a distinct desmoplastic class. Using HC desmoplastic samples were scattered among leaves and there was no level of the tree where they could split the branches to expose a clear desmoplastic cluster. They applied SOM by using two to eight centroids but did not recover distinct desmoplastic class as well.
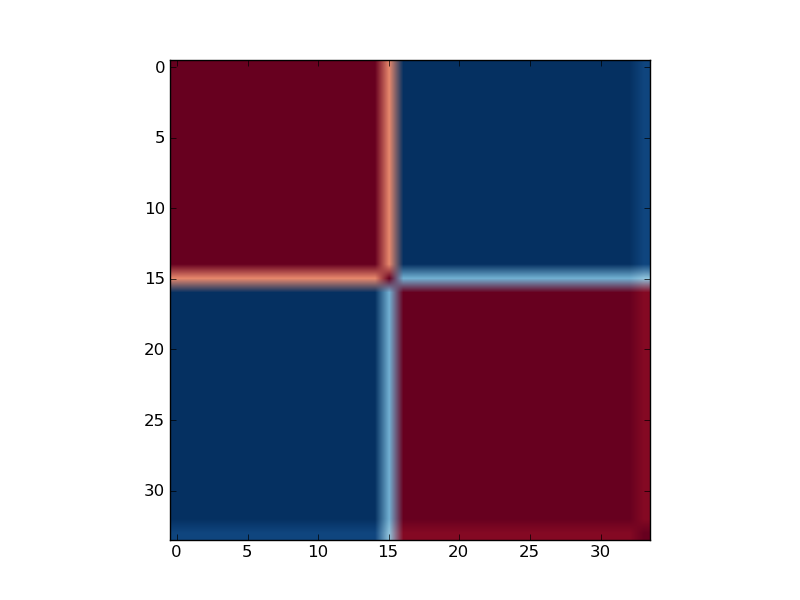
Reordered consensus matrix generated for rank, rank = 2. Reordered consensus matrix averages 50 connectivity matrices computed at rank = 2, 3 for the medulloblastoma data set consisting of 25 classic and 9 desmoplastic medulloblastoma tumors. Consensus matrix is reordered with HC by using distances derived from consensus clustering matrix entries, coloured from 0 (deep blue, samples are never in the same cluster) to 1 (dark red, samples are always in the same cluster).
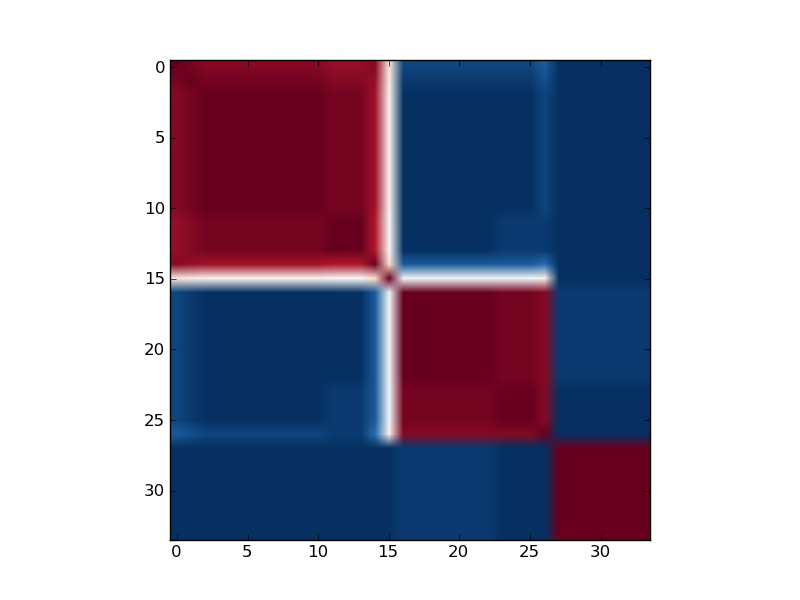
Reordered consensus matrix generated for rank, rank = 3.
| Sample | Class | rank = 2 | rank = 3 | rank = 5 |
|---|---|---|---|---|
| Brain_MD_7 | C | 0 | 1 | 3 |
| Brain_MD_59 | C | 1 | 0 | 2 |
| Brain_MD_20 | C | 1 | 1 | 3 |
| Brain_MD_21 | C | 1 | 1 | 3 |
| Brain_MD_50 | C | 1 | 1 | 4 |
| Brain_MD_49 | C | 0 | 2 | 3 |
| Brain_MD_45 | C | 1 | 1 | 3 |
| Brain_MD_43 | C | 1 | 1 | 3 |
| Brain_MD_8 | C | 1 | 1 | 3 |
| Brain_MD_42 | C | 0 | 2 | 4 |
| Brain_MD_1 | C | 0 | 2 | 3 |
| Brain_MD_4 | C | 0 | 2 | 3 |
| Brain_MD_55 | C | 0 | 2 | 3 |
| Brain_MD_41 | C | 1 | 1 | 2 |
| Brain_MD_37 | C | 1 | 0 | 3 |
| Brain_MD_3 | C | 1 | 2 | 3 |
| Brain_MD_34 | C | 1 | 2 | 4 |
| Brain_MD_29 | C | 1 | 1 | 2 |
| Brain_MD_13 | C | 0 | 1 | 2 |
| Brain_MD_24 | C | 0 | 1 | 3 |
| Brain_MD_65 | C | 1 | 0 | 2 |
| Brain_MD_5 | C | 1 | 0 | 1 |
| Brain_MD_66 | C | 1 | 0 | 1 |
| Brain_MD_67 | C | 1 | 0 | 3 |
| Brain_MD_58 | C | 0 | 2 | 3 |
| Brain_MD_53 | D | 0 | 2 | 4 |
| Brain_MD_56 | D | 0 | 2 | 4 |
| Brain_MD_16 | D | 0 | 2 | 4 |
| Brain_MD_40 | D | 0 | 1 | 0 |
| Brain_MD_35 | D | 0 | 2 | 4 |
| Brain_MD_30 | D | 0 | 2 | 4 |
| Brain_MD_23 | D | 0 | 2 | 4 |
| Brain_MD_28 | D | 1 | 2 | 1 |
| Brain_MD_60 | D | 1 | 0 | 0 |
To run the example simply type:
python medulloblastoma.py
or call the module’s function:
import nimfa.examples
nimfa.examples.medulloblastoma.run()
Note
This example uses matplotlib library for producing a heatmap of a consensus matrix.
- nimfa.examples.medulloblastoma.plot(C, rank)
Plot reordered consensus matrix.
Parameters: - C (numpy.ndarray) – Reordered consensus matrix.
- rank (int) – Factorization rank.
- nimfa.examples.medulloblastoma.read(normalize=False)
Read the medulloblastoma gene expression data. The matrix’s shape is 5893 (genes) x 34 (samples). It contains only positive data.
Return the gene expression data matrix.
- nimfa.examples.medulloblastoma.reorder(C)
Reorder consensus matrix.
Parameters: C (numpy.ndarray) – Consensus matrix.
- nimfa.examples.medulloblastoma.run()
Run Standard NMF on medulloblastoma data set.
- nimfa.examples.medulloblastoma.run_one(V, rank)
Run standard NMF on medulloblastoma data set. 50 runs of Standard NMF are performed and obtained consensus matrix averages all 50 connectivity matrices.
Parameters: - V (numpy.ndarray) – Target matrix with gene expression data.
- rank (int) – Factorization rank.
